The Breakdown tab
Fördelning answers the recurring end-of-month question: how many sales were there in the period, what were they worth, and how does that split by whoever or whatever you care about this month.
A filtered list can pick the right deals but it does not add them up, and the filter bar has no counting or totalling. That is what this tab is for.
Read a month
- 1Open Rapporter and choose Fördelning.
- 2Pick a Period — Förra månaden is the usual one. Valda datum lets you set Från and Till yourself.
- 3Pick a Fördela på. The list contains Säljare, Fas, Kund and Källa, plus every field your company added to a sale — so a company that records a product, a meeting booker or an account manager on each sale can break the period down by any of them.
- 4Leave Affärer som räknas med on Vunna for revenue. Förlorade, Fortfarande öppna and Alla are there when you want the other side of the picture.
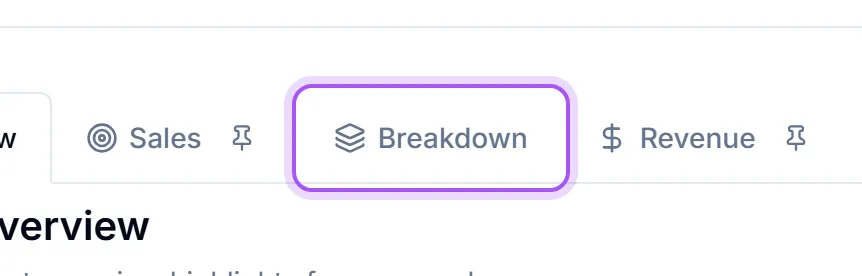
Each row is one group with Affärer and Värde, biggest value first, and a Totalt line under them. Ladda ner CSV saves the same rows as a spreadsheet.
Which date the period uses
Räkna affärer efter decides which date puts a sale inside the period.
- Avslutsdatum — when the sale was closed. This is the one you want for "what did we sell in June".
- Skapad-datum — when the sale was first created. Use it to ask how much was *started* in the period rather than finished.
Which stages count as won is your own pipeline's setting, not a fixed word: Edit your pipeline in the builder. So a company whose winning stage is called something else still gets the right rows.
Rows without a name
Two rows can look empty, and they mean different things.
- Inte angivet — the field was simply left blank on those sales. Their value is still counted in the total. A large Inte angivet row is worth fixing at source, because every breakdown built on that field is only as complete as the field is.
- Inte längre tillgänglig — the person or record the sales point at no longer exists in your company.
What it does not do
- It reads sales only. For recurring revenue use The Revenue tab.
- It groups by one thing at a time. For several figures side by side, formulas or a chart to save and share, build a report instead: Build a custom report.
- Money is always shown in your company's own currency. Sales in a currency with no exchange rate available are left out of the total rather than added in the wrong unit, and the tab says so when that happens.
- If you can see only your own sales elsewhere in DealJourney, you see only your own here too: Show only your records, your team's, or everyone's.
Var det här till hjälp?