Reports
Reports are where numbers come from. A filtered list tells you which records match; a report tells you how many, how much, and broken down by what.
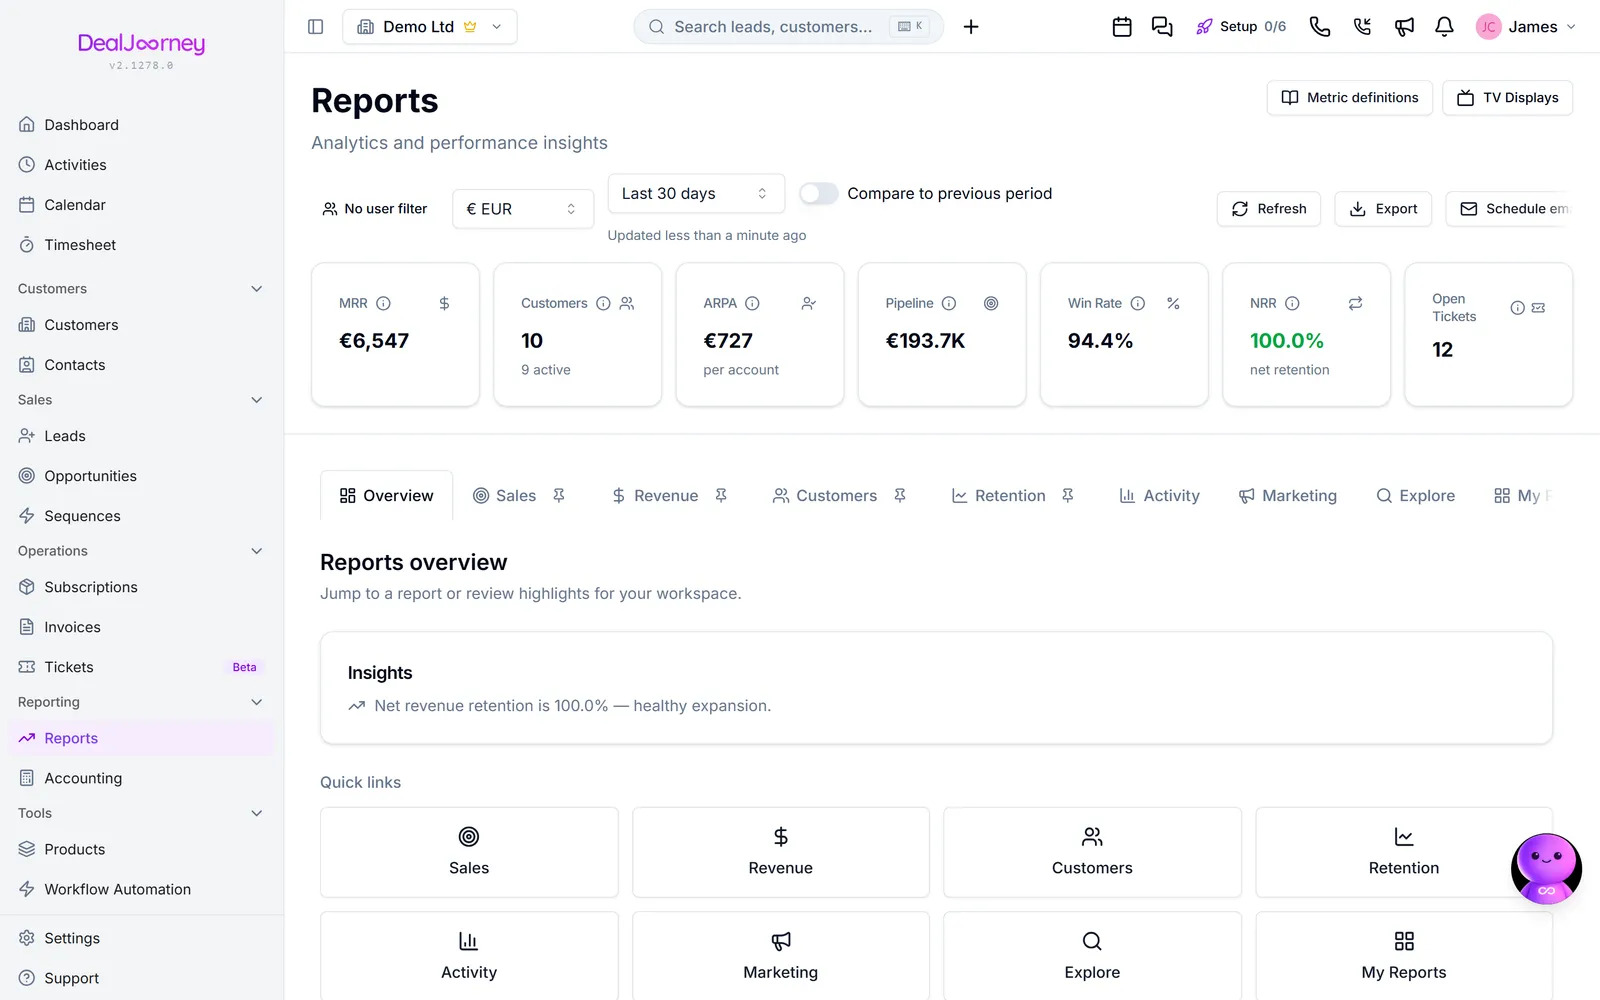
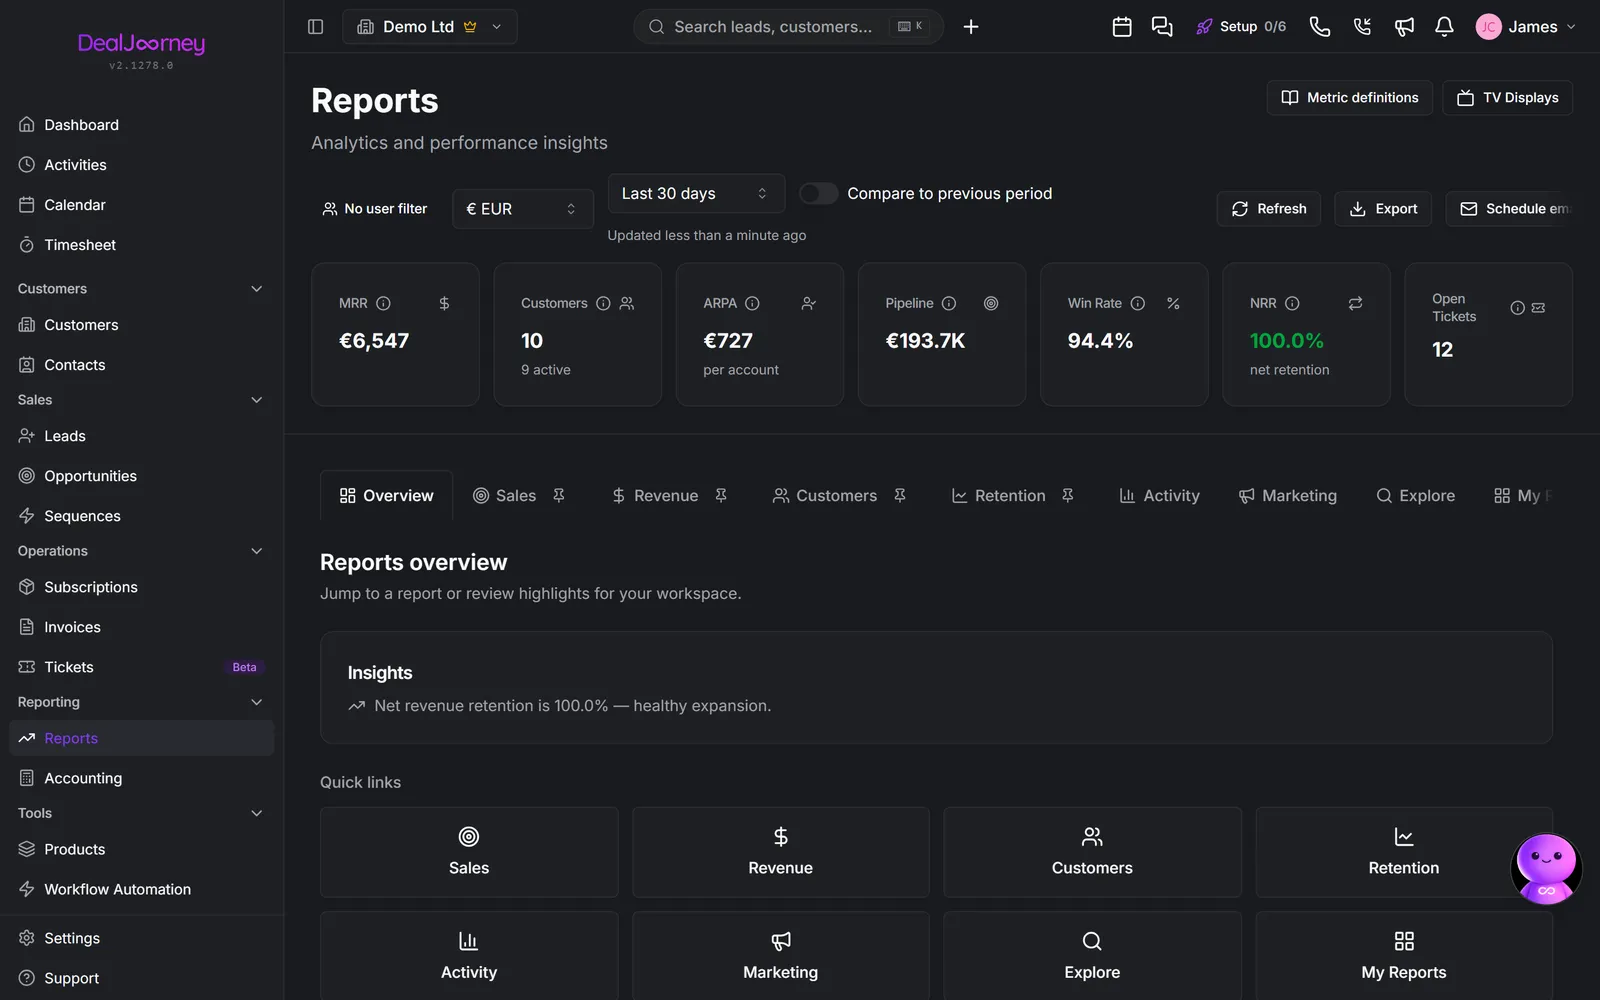
Reach them from Rapporter in the sidebar.
Use a report whenever the answer is a number you would act on. Totals, counts, revenue by month, deals by owner, win rates. Counting rows on a screen works until the list is longer than a page, and then it quietly stops being right.
Use a filtered list instead when you want to see and work the individual records: call them, edit them, check them one by one.
A report is built from four choices, and they map onto the question you are asking in plain language:
- Datakälla: what kind of record you are measuring: Affärsmöjligheter, Kunder, Fakturor and so on.
- Conditions: which of those records to include.
- Metric: what to work out, such as a count, a sum, or an average.
- Gruppera efter: how to break the answer up, by month, by owner, or by stage.
So "how much did we win per month this year" is opportunities, filtered to won and this year, summing the amount, grouped by month.
Reports are saved and reusable, so a question worth asking twice is worth building once.
I det här avsnittet
Build a custom report
Build a report around your own question rather than a fixed template
Make a report ask you for a value when it runs
One saved report you run again and again for a different project, customer or year
Report on the products you have sold
Total, group and filter the individual product lines on your deals rather than the deal totals
Report on revenue per seller, split between them
Total deal money by the person who earned it, giving each contributor their share of a shared deal instead of all of it to one name
Build a report that lists records, not totals
Choose a set of columns and get one row per record, the way the customer and contact tables look, with totals underneath and bulk actions on the rows you tick
Share a report and put it on a dashboard
Get a report in front of the people who need it, or onto a dashboard
Email figures to yourself or your team on a schedule
Send a whole report, or a digest of the exact figures you pick, on a repeating schedule
Type in figures the CRM does not hold
A year-by-year grid of monthly and quarterly metrics you maintain by hand
Which report answers your question
The reports on this page, each answering a different question — the map from question to report
The Overview
Build your own dashboards from the reports' numbers and charts
The Sales tab
Pipeline, forecast, win rate, and why you are losing
The Breakdown tab
A period of sales counted and totalled per seller, per meeting booker, per product
The Revenue tab
MRR and what moves it — expansion, churn, and net revenue retention
The Customers tab
Who is valuable, who is disengaging, and who is about to leave
The Retention tab
Cohorts followed forward — whether you are getting better at keeping customers
The Activity tab
What your team is actually doing, and what support is dealing with
The Marketing tab
Sends, opens, clicks and unsubscribes across your campaigns
The Explore tab
The records behind the charts — filter them, read them, export them
Vanliga frågor
- How much ARR did we have each month?
- Ask me for the date period when the report opens
- How much did we sell of one product?
- How much did each salesperson bring in?
- Can I choose columns in a report?
- How do I share a report?
- Email me my activities due today every morning
- Where do I type in budget numbers?
- What are the reports tabs?
- This quarter versus last quarter
- Why are we losing deals?
- How much did each person sell?
- Monthly recurring revenue
- Which customers might leave
- Are we keeping customers?
- What has the team done this month?
- Marketing tab is locked
- Which customers are in this number